Quintessential Visualization Tool – TIBCO Spotfire
Posted on October 1, 2018 by DEFTeam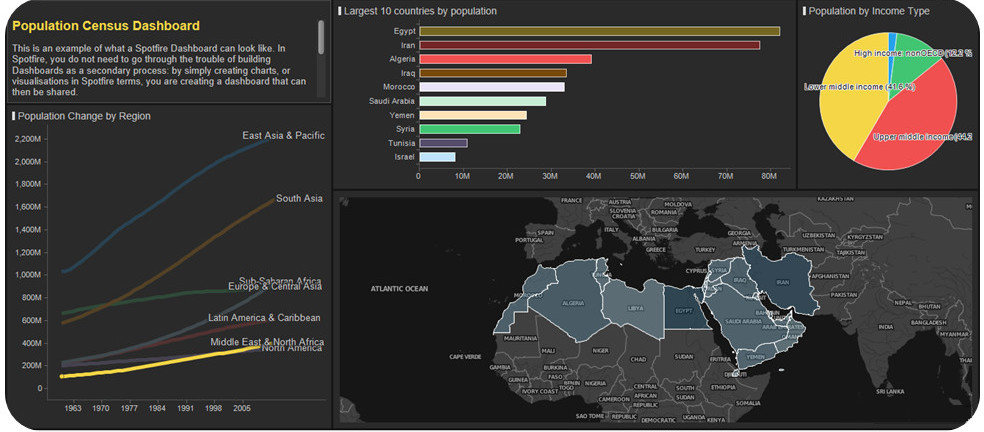
TIBCO Spotfire is a prime example of a high-quality and sophisticated visualization tool. It helps businesses make informed decisions for future growth and predicts key performance indicators (KPIs), offering valuable insights from complex data. With TIBCO Spotfire, businesses can identify opportunities, understand where they are headed, and much more.
Compared to other visualization tools on the market, TIBCO Spotfire stands out due to its flexibility, scalability, and suitability for organizations of any size. It enables rapid data analysis, and with just a click, users can view data from various perspectives, select the most impactful representation, and share it seamlessly across the organization.
TIBCO Spotfire is well-aligned with future trends in Business Intelligence (BI), where users are increasingly opting for self-service BI over traditional fixed reports and dashboards. It also offers predictive analytics that not only shows what might happen, but also guides users on what actions to take. The tool is powerful, simple, cost-effective, and promotes democratized BI—making BI accessible to everyone in the organization.
TIBCO Spotfire excels in several areas in terms of features:
- Data Handling Capacity: Spotfire can manage massive amounts of data, from small flat files to big data systems like Hadoop, without any limitations (given adequate hardware support).
- In-Memory, In-Database Analysis: This makes Spotfire faster and more unique compared to other visualization tools.
- User-Friendly Interface: Its simple, seamless UI enables data scientists and analysts to quickly build analytics applications for end users or business users.
- Deployment Flexibility: Spotfire supports deployment for both small and large organizations.
- Automation Services: Spotfire can automate the delivery of reports at scheduled intervals, take snapshots of data or visualizations when certain events occur, or trigger actions based on specific conditions.
- Scalability: Spotfire’s scalability enhances its productivity, adapting to growing organizational needs.
- Offline Work Mode: The “Work Offline” feature allows users to create visualizations without being connected to a server. When the server is available again, users can sync and deploy their analyses. This is especially useful when traveling or when server connectivity is unavailable.
- Bookmarks and Collaboration: Users can save dashboard instances using bookmarks and retrieve them when needed, allowing for easy comparisons. The collaboration feature facilitates communication and teamwork.
- Data Analysis Flexibility: Spotfire supports a simplified storytelling approach to data analysis, allowing users to work with both structured and unstructured data, whether it’s historic or real-time, from internal or external sources, and across cloud or on-premise systems.
- Geolocation and Predictive Analytics: Spotfire places a strong emphasis on these features, helping users make better decisions and gain a competitive advantage.
- Advanced Modeling: Users can create new data models using TERR (TIBCO Enterprise Runtime for R), R, or S+.
- User Authentication and Security: Spotfire provides easy user authentication and authorization, with connections to MS-AD (Microsoft Active Directory) and LDAP (Lightweight Directory Access Protocol) for enhanced security across the organization.
- Advanced Visualization Options: Users can drill down and roll up dashboards using filters, sliders, hierarchical filters, and hyperlinks for detailed visualizations. Additionally, Python scripting and HTML can be used to extend functionality, such as exporting dashboards to PDF.
- Highly Interactive Visualizations: Spotfire offers customizable charts, maps with layers, treemaps, parallel coordinate charts, and heatmaps, enabling users to analyze data from multiple dimensions without needing queries, OLAP cubes, indexes, or formulas.
- Sharing Insights: Users can easily share their findings with peers, end users, and business users via the TIBCO server.
- Recommended Visualizations: Spotfire offers built-in intelligence to suggest the best-fit visualizations for users, helping them choose the right tools for data analysis or storytelling.
- Customizable Themes: Dashboards can be displayed in a variety of built-in or customizable themes.
- Cost-Effective: Organizations don’t need to invest heavily in employee training. With just a few hours of instruction, users can create dashboards ranging from simple to complex.
Undoubtedly, TIBCO Spotfire is the leading visualization tool and is poised to capture a larger market share. It is an essential solution for today’s CXOs, providing the tools they need to make informed, data-driven decisions.