SAS Visual Analytics
SAS Visual Analytics (VA) is an in-memory business intelligence tool designed for businesses of all sizes across various industries. Whether in Pharma, Manufacturing, Government, Banking, Technology, Research, or other sectors, organizations can tailor BI solutions to meet their specific needs.The SAS Analytics solution can be deployed on-cloud or on-premise.
Some of the fascinating features of SAS VA are geo-analytics, in-memory analytics, data mining and predictive analytics to find out deeply hidden patterns in your diverse data and seize the market opportunity and find out why something happened. Interactive reports, dashboards & scorecards, ETL capabilities, online analytical processing (OLAP), query-based reports, data warehouse, self-service for everyone, social media text analysis, mobile BI, user authentication and content authorization.
The Application can be integrated seamlessly with your existing application or can be offered as stand-alone. A user can be authenticated using extended DB, token and LDAP based authentication etc. Reports can be accessed via mobile phones and emails.
Case Studies
A financial giant had a requirement to handle a large amount of data, process it in-memory, and populate visualizations that help support business decisions. DEFTeam implemented an end-to-end BI solution using SAS Visual Analytics, which is a powerful in-memory reporting and analysis tool. The implementation included an arrangement to connect to multiple data sources and pull the data into SAS VA’s LASR servers. The data was then periodically refreshed and appended to keep it updated as per business logic. Seamless integration with the client’s Active Directory was implemented, and thus SAS VA users were synchronized with an AD. The reports & dashboards were designed to be responsive, resulting in a better viewing experience on mobile devices.
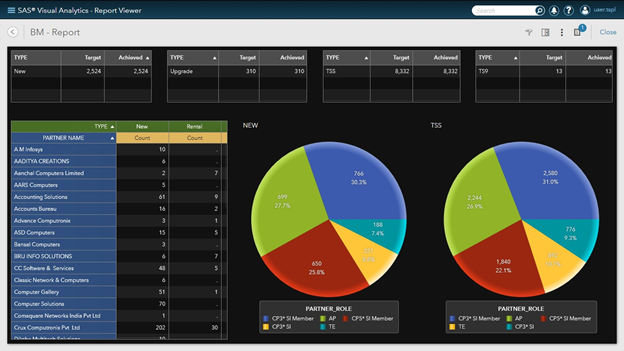
An online marketplace required a visualization and analytics tool to analyze data generated by their online transportation B2B offering. DEFTeam used SAS Visual Analytics to develop various business reports in visual and tabular format.
DEFTeam was involved right from requirements gathering, report template creation to design and develop content rich and visually appealing reports which help the business take right decisions based on the information provided, thus making it an end-to-end BI solutions engagement using SAS Visual Analytics.
The reports included various reporting functionalities like parameters, functions, cascading filters, report and section linking, info windows inside reports, etc., to name a few.